
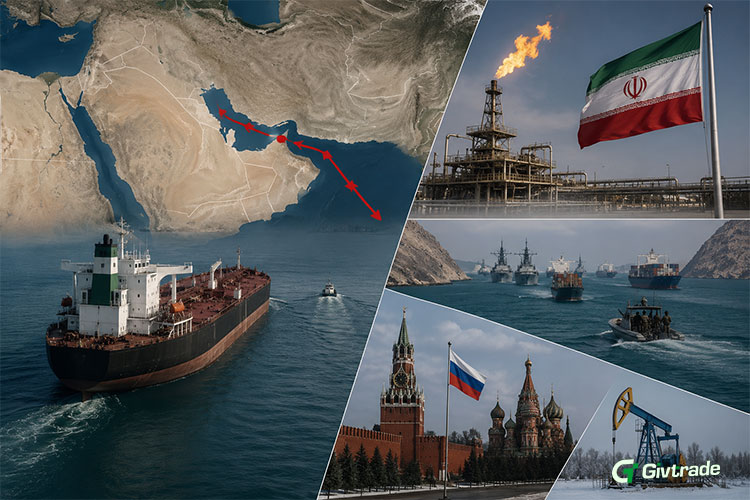
Beyond Hormuz: How Red Sea, Iran and Russia Supply Risks Move Oil Prices for GCC Traders
Tableof Contents
1. The Four Risks Beyond Hormuz: A Quick Reference
2. Red Sea and Bab el-Mandeb: The Second Frontin 2026
3. Iran: Sanctions, Exports and the Nuclear Negotiation Variable
4. Russia: Sanctioned Barrels and the Shadow Fleet
5. Libya and Nigeria: The Quiet Volatility Producers
6. How GCC Traders Layer These Risks Instead of Tracking Them Separately
7. Frequently Asked Questions
8. The Bottom Line
The Strait of Hormuz gets most of the geopolitical risk premium attention in oil markets — and rightly so. But 2026 has confirmed something experienced GCC oil traders have long understood: Hormuz is not the only chokepoint that matters. The Red Sea and Babel-Mandeb Strait, Iran's sanctioned export volumes, and Russia's sanctioned shadow fleet are three separate, simultaneous supply risks that can each move Brent crude independently — and occasionally compound each other into a single historic supply shock. By April 2026, the combined disruption risk across Hormuz and the Red Sea alone was estimated at 4–9 million additional barrels per day, on top of the Hormuz losses already in the market. Traders who track only Hormuz are missing roughly half of the geopolitical risk premium currently priced into Brent crude CFDs.
The Four Risks Beyond Hormuz: A Quick Reference
Red Sea and Bab el-Mandeb: The Second Front in 2026
The Red Sea crisis began in late 2023 when Houthi forces started targeting commercial shipping transiting the Bab el-Mandeb Strait, the narrow water way connecting the Red Sea to the Indian Ocean and feeding the Suez Canal. By 2026, this has become what shipping analysts describe as the industry's “new normal” — not resolved, not escalated to full closure, but a persistent, elevated-risk environment that periodically spikes.
The numbers show sustained disruption: Suez Canal traffic share of global maritime trade fell from roughly 12% to 9%, and container transits collapsed nearly 90% at the crisis peak. By mid-2026, most carriers still default to the longer Cape of Good Hope route,with diversions expected to continue through at least 2027.
For oil specifically, the risk escalated sharply in 2026. With Saudi Arabia ramping Yanbu crude exports to arecord 4.0–4.3 million bpd in March 2026 to help offset Hormuz losses, acredible Houthi threat to block Bab el-Mandeb entirely would put that same route at risk — alongside remaining Russian product flows and Suez-transiting volumes. Energy News Beat estimated the total potential disruption at 4–9 million bpd, which combined with Hormuz represented a potential 20–25% removal of global seaborne crude from efficient transit — two chokepoints compounding at once.
The critical distinction for GCC traders: Red Sea risk is episodic and attack-driven, not a constant closure. Brent reacts sharply to specific attack headlines — a tanker hit, amajor shipping line suspending transits (BP, Shell, and Qatar Energy have all paused Red Sea transits at various points) — then partially settles as the market assesses whether the attack signals an escalation or an isolated incident. Gulf traders who track GivTrade's news section for tanker-specific incidents (not just general Houthi statements) catch the moves that matter most.
Iran: Sanctions, Exports and the Nuclear Negotiation Variable
Iran exports an estimated 1.5–2million barrels per day of crude, primarily to China, despite US sanctions.This volume moves Brent through two distinct mechanisms that GCC traders track separately.
• Sanctions enforcement intensity: When the US tightens enforcement — sanctioning specific tankers, ports, or buyers — Iranian export volumes that reach the market tend to fall, tightening global supply and supporting Brent. When enforcement loosens or buyers find work arounds, supply effectively increases even without any change in headline policy.
• Nuclear negotiation status: Any credible signal of a renewed nuclear deal historically raises expectations of sanctions relief and a return of Iranian barrels to the legal market — a bearish signal for Brent. Conversely, negotiation breakdown or military escalation (as occurred inearly 2026) raises the probability of tighter restrictions and supply-side bullish pressure.
The 2026 conflict illustrates both dynamics colliding: strikes on Iranian targets in February 2026 triggered Hormuz closure threats while simultaneously tightening export sanctions enforcement. A Hormuz resolution does not automatically restore Iranian export volumes if enforcement stays tight — the two risks are related but separate.Tracking both through market reports gives the fuller picture.
Russia: Sanctioned Barrels and the Shadow Fleet
Russia exports an estimated 4–5million barrels per day of crude despite Western sanctions imposed since 2022,using what has become known as the “shadow fleet” — aging tankers operating with obscured ownership, flags of convenience, and ship-to-ship transfers designed to circumvent the G7 price cap mechanism. This is structurally different from Hormuz or Red Sea risk: it is not a single chokepoint event butan ongoing, slow-moving supply variable.
The price impact works through capacity and discount erosion, not sudden spikes. As the shadow fleet has expanded since 2022, Russian crude keeps reaching India and China at a discount to Brent — but each new sanctions round on specific tankers or insurers tightens available shipping capacity, nudging global supply modestly tighter rather than producing the sharp spikes seen with Hormuz or Red Sea attacks.
For GCC traders, Russia-related headlines (new sanctions, shadow fleet seizures, price cap revisions) rarely produce the 2–6% single-session moves OPEC or Hormuz headlines do. They matteras a background supply-tightness indicator over weeks, relevant context within GivTrade's analysis section rather than an immediate trigger.
Libya and Nigeria: The Quiet Volatility Producers
Libya and Nigeria receive farless media attention than Hormuz, the Red Sea, Iran, or Russia — but both countries produce frequent, unplanned production outages that move oil prices with regularity most retail traders underestimate. Libya's oil infrastructure remains fractured by ongoing political division between rival governments, with field shutdowns, pipeline blockades, and export terminal closures occurring multiple times per year, typically removing 0.3–1 million bpd for days to weeksat a time. Nigeria faces a combination of pipeline vandalism, militant activityin the Niger Delta, and OPEC quota compliance issues that produce similar intermittent volume losses.
The pattern for GCC traders: these outages produce sharp, fast Brent reactions (+0.5–1.5% is typical) precisely because they are unplanned and not priced in advance the way a scheduled OPEC meeting is. But they also retrace faster than Hormuz or Red Sea events, because the affected volumes are smaller and alternative supply can often be sourced more easily. Traders who only monitor the “big four” headline risks (Hormuz, Red Sea, Iran, Russia) are sometimes caught off guard by a Libya pipeline shutdown that moves Brent 1% with no warning — which is why GivTrade's news section covering these lower-profile producers matters for anyone holding oil CFD positions through any given week.
How GCC Traders Layer These Risks Instead of Tracking Them Separately
The traders across the GCC who manage geopolitical oil risk most effectively layer Hormuz, Red Sea, Iran, and Russia into a single risk-aggregation framework rather than four unrelated news streams — because in 2026 these risks increasingly compound, as shown when RedSea risk emerged specifically because of Hormuz-related escalation.
• Check for compounding before sizing a position. A Hormuz-only disruption and a simultaneous Hormuz-plus-Red Sea disruption are not the same magnitude. Saudi Yanbu exports became the primary Hormuz bypass in 2026 — then were threatened directly, showing how a secondary chokepoint becomes critical once the primary one is compromised.
• Separate spike-driven risks from slow-moving ones. Hormuz, Red Sea, and Libya/Nigeria outages are spike-and-retrace events tradeable onshort time frames. Iran sanctions enforcement and Russia's shadow fleet are slow-moving baseline shifts, better used as medium-term context than entry triggers.
• Use Brent over WTI for all four. Every one of hese risks affects internationally traded, waterborne crude — exactly what Brent prices. WTI responds with a lag and smaller magnitude.
• Track shipping data over political statements. Verified tanker movement and shipping line announcements (BP, Shell, Qatar Energy pausing transits) confirm whether a threat is materializing far more reliably than rhetoric alone.
Frequently Asked Questions
How does the Red Sea crisis affect oil prices for GCC traders?
Houthi attacks have forced most tankers to reroute around the Cape of Good Hope since late 2023, with Suez Canal traffic falling roughly 90% at the crisis peak. Major suspensions by BP,Shell, and Qatar Energy on Red Sea transits have periodically supported Brent, and risk escalated in 2026 when Houthi threats to block Bab el-Mandeb coincided with the Hormuz crisis, with analysts estimating combined disruption potential of 4–9 million bpd. Track developments via GivTrade's news section.
How much oil does Iran export despite sanctions?
Iran exports an estimated 1.5–2 million barrels per day, primarily to China. Price impact depends on two variables: sanctions enforcement intensity (tighter enforcement supports Brent)and nuclear negotiation status (renewed deal prospects are bearish). GCC traders track both through market reports.
What is Russia's shadow fleet and how does it affect oil prices?
Russia's shadow fleet — aging tankers with obscured ownership — exports an estimated 4–5 million bpd of sanctioned crude, circumventing the G7 price cap. Unlike Hormuz or Red Sea risk, this is a slow-moving variable: new sanctions on tankers or insurers periodically tighten capacity and provide gradual, modest support to Brent rather than sharp single-session spikes.
Why do Libya and Nigeria oil outages matter despite less media coverage?
Libya and Nigeria produce frequent unplanned outages of 0.3–1 million bpd from political instability and pipeline vandalism, occurring multiple times per year with little warning. These move Brent 0.5–1.5% with fast retracement, catching traders off guard who only monitor higher-profile risks. Following GivTrade's news section helps avoid being caught off-side on oil CFD positions.
Should GCC traders track these four risks separately or together?
Experienced GCC traders layer all four into one framework rather than tracking them separately, since they increasingly compound — as in 2026, when Red Sea risk emerged because Saudi Arabia's Hormuz bypass route became a Houthi target. The practical approach: separate fast spike-driven risks (Hormuz, Red Sea, Libya/Nigeria) from slow-moving ones (Iran sanctions, Russia's fleet), and use Brent CFDs for all four.
The Bottom Line
Hormuz dominates the geopolitical oil risk conversation for good reason, but 2026 confirmed it rarely operates alone. Red Sea attacks escalate precisely when Hormuz-related military action intensifies. Iran's export volumes move independently of — but often alongside — the wider Iran risk premium. Russia's shadow fleet provides aslow-moving baseline. Libya and Nigeria add recurring, lower-profile volatility that catches single-risk-focused traders off guard.
The GCC traders who navigatethis multi-risk environment most consistently treat it as a layered system — distinguishing spike-driven chokepoint events from slow-moving sanctions dynamics, using Brent crude CFDs as the primary vehicle for all four, and checking GivTrade's news section and market reports for the verified shipping and export data that separates real supply events from political noise.
Track ongoing developments across all four risk categories in GivTrade's news section, monitor the economic calendar for related OPEC and EIA events, explore oil CFD trading, and review account options including swap-free configurations for multi-day positions held through extended geopolitical risk periods.
Risk Warning: Trading oil CFDs and other Contracts for Difference on margin carries a high level of risk. Retail clients could sustain a total loss of deposited funds. This article is for informational and educational purposes only and does not constitute investment advice. Data: Energy News Beat April 2026, Coface December 2025, S&P Global February 2026, Suaid Global mid-2026. GivTrade Mauritius, registration No. 197387, is authorized and regulated by the Financial Services Commission (FSC) License No.GB22201329.


