

How to Use Moving Averages in Forex Trading: UAE & GCC Trader's Guide (2026)
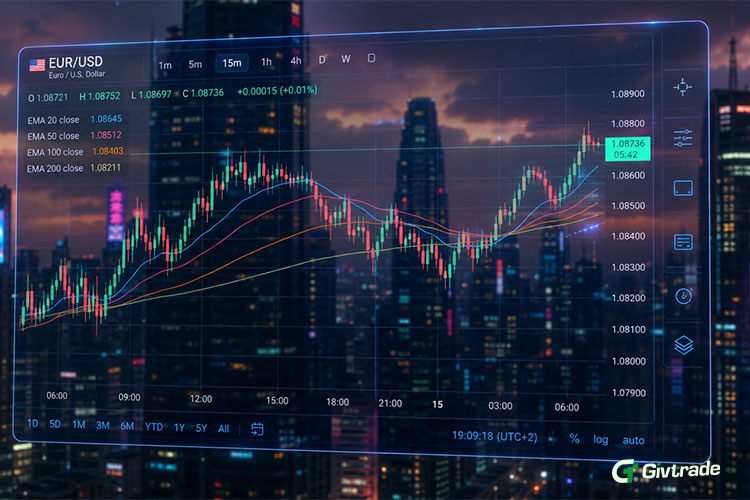
Price charts tell a story. The problem is they tell it loudly - every spike, every reversal, every false move competes for attention equally. Moving averages cut through that noise.
For UAE and GCC traders using technical analysis, the moving average is the most widely used trend tool in forex - and the most misunderstood when used in isolation.
Used correctly, moving averages help GCC traders answer the question that matters most before any entry: is the market trending, and in which direction? That single filter, applied consistently, eliminates a significant percentage of the counter-trend trades that drain accounts in the first year of active trading.
What a Moving Average Actually Is
A moving average is a line plotted on a price chart that calculates the average closing price of a currency pair over a defined number of periods. On a daily chart, a 20-period moving average calculates the average closing price across the last 20 trading days and plots a single point for each day. As each new day closes, the oldest day drops off and the newest closes joins the calculation - hence "moving."
The result is a smoothed line that removes short-term price noise and reveals the underlying direction of price over the chosen period. When price is consistently above the moving average, the market is in an uptrend relative to that timeframe. When price is consistently below it, the trend is down. When price is choppy around the line, the market is ranging - and moving average signals in ranging conditions are unreliable.
SMA vs EMA: The Difference That Matters for GCC Traders
Two types of moving averages dominate forex trading: the Simple Moving Average (SMA) and the Exponential Moving Average (EMA). Both calculate an average of past prices, but they weight that average differently.
The SMA gives equal weight to every period in the calculation. A 20-period SMA treats the closing price from 20 days ago the same as yesterday's close. The result is a smoother, slower line that is less reactive to sudden price moves.
The EMA gives more weight to recent closing prices. The most recent closes influence the line more than older ones. The result is a faster line that reacts more quickly to current price action - which means it generates earlier signals but also more false ones during choppy markets.
For GCC traders on the MetaTrader 5 platform, both are available under the trend indicators menu and can be applied to any instrument - forex pairs, gold, oil CFDs, or indices - in seconds. Neither is universally better. The EMA suits traders who want earlier signals and are comfortable with occasional false moves. The SMA suits traders who prefer confirmation over speed and are willing to enter slightly later in a move.
The Three Ways Experienced GCC Traders Use Moving Averages
As a trend filter. Before any trade entry, GCC traders who use moving averages check which side of the line price is on. A bullish EUR/USD setup carries more conviction when price is above the 50-period EMA than when it is below it. The moving average does not generate the trade idea - it filters it. Long setups above the MA, short setups below. That single discipline eliminates a significant portion of counter-trend entries.
As dynamic support and resistance. In a trending market, price routinely pulls back to the moving average before continuing in the original direction. The 20 EMA and 50 EMA are the most watched levels for this behaviour on forex charts. A clean pullback to the 20 EMA on EUR/USD in an established uptrend - followed by a rejection candle - is one of the most consistent entry setups in technical forex trading. GCC traders who track these levels alongside market reports for macro context enter pullbacks with both technical and fundamental alignment.
As a crossover signal. When a faster moving average crosses above a slower one - for example, the 20 EMA crossing above the 50 EMA - it signals that short-term momentum is turning bullish relative to the longer-term trend. The reverse crossover signals bearish momentum. This is the most commonly cited moving average strategy and also the most commonly misused - crossover signals in ranging markets generate frequent false entries. Experienced GCC traders use crossovers as confirmation tools in already-trending markets, not as standalone trade triggers in flat conditions.
The Periods GCC Traders Watch Most
Not all moving average periods carry equal weight. The most commonly watched levels across professional and retail forex traders globally - and the ones most likely to act as genuine support, resistance or signal levels because enough participants are watching them:
• 20 EMA - Short-term trend filter. Most useful on H4 and daily charts for active swing traders.
• 50 EMA - Medium-term trend. The line most institutional traders reference for trend direction on daily charts.
• 100 SMA - Intermediate trend. Often acts as a significant support or resistance level on daily and weekly charts.
• 200 SMA - Long-term trend benchmark. The most watched moving average in professional forex trading. Price above the 200 SMA on a daily chart is the broadest definition of a long-term uptrend. Major reversals at the 200 SMA are widely tracked across all currency pairs and instruments including gold and oil CFDs.
For GCC traders checking the economic calendar before each session, key data releases near a major moving average level - particularly the 50 or 200 - are sessions worth noting. A strong NFP or CPI print that pushes price through the 200 SMA on EUR/USD is a structurally significant move, not just a data-day reaction.
What Moving Averages Cannot Do
Moving averages are lagging indicators. They are calculated from past prices, which means they confirm trends after they have started - not before. In fast-moving markets driven by sudden news events, a moving average line will not help you anticipate the move. It will only confirm it after price has already moved.
This is why experienced GCC traders combine moving averages with the economic calendar and live market reports rather than using them as a self-contained system. The moving average tells you the trend. The macro context tells you whether that trend has a reason to continue. Used together, they provide a more complete picture than either offers alone. For traders who have already covered support and resistance basics in our support and resistance guide, moving averages are the natural next layer - dynamic levels that move with price rather than fixed horizontal zones.
The GivTrade Take
Most GCC traders encounter moving averages early and either over-rely on them or dismiss them after a string of false crossover signals in a ranging market. Both reactions miss the point. Moving averages are not trade generators - they are context tools. They answer one question: what is the trend on this timeframe? Once that question is answered, every subsequent trading decision is made with that context in place.
The GCC traders who use moving averages most effectively share one habit: they apply the 50 EMA and 200 SMA to their daily chart before opening any position, note which side of each line price is on, and use that as a non-negotiable filter for trade direction. They do not trade against both lines simultaneously. That single discipline, combined with a defined entry trigger and a stop loss placed beyond the nearest moving average, consistently reduces the proportion of losing trades that result from entering against the prevailing trend.
Explore forex and CFD instruments on GivTrade and apply moving averages directly in MetaTrader 5 via the trend indicators menu on any chart.
Frequently Asked Questions
What is a moving average in forex trading?
A line on a price chart showing the average closing price over a set number of periods - used to identify trend direction and filter trade entries by keeping positions aligned with the prevailing trend.
What is the difference between SMA and EMA?
The SMA weights all periods equally for a smoother, slower line. The EMA weights recent prices more heavily for a faster, more reactive line. EMAs generate earlier signals; SMAs provide more confirmation before signalling.
Which moving average period should GCC traders use?
The 20 EMA for short-term trend context, the 50 EMA for medium-term direction, and the 200 SMA as the key long-term benchmark. These are the most widely watched periods across professional and retail forex markets globally.
What is a moving average crossover?
When a faster MA crosses above or below a slower MA - signalling a potential shift in momentum. Most reliable as a confirmation tool in trending markets; prone to false signals in ranging conditions.
Can moving averages be used on gold and oil CFDs?
Yes - moving averages apply to any instrument available on MetaTrader 5, including XAU/USD, Brent crude, indices and all forex pairs. The same principles of trend filtering and dynamic support apply across instruments.
Risk Warning: Trading forex and Contracts for Difference (CFDs) on margin carries a high level of risk. Retail clients could sustain a total loss of deposited funds. This article is for informational and educational purposes only and does not constitute investment advice. GivTrade Mauritius, registration No. 197387, is authorized and regulated by the Financial Services Commission (FSC) License No. GB22201329.