

What Is a Bear Trap in Trading? How GCC Traders Avoid Getting Caught (2026)
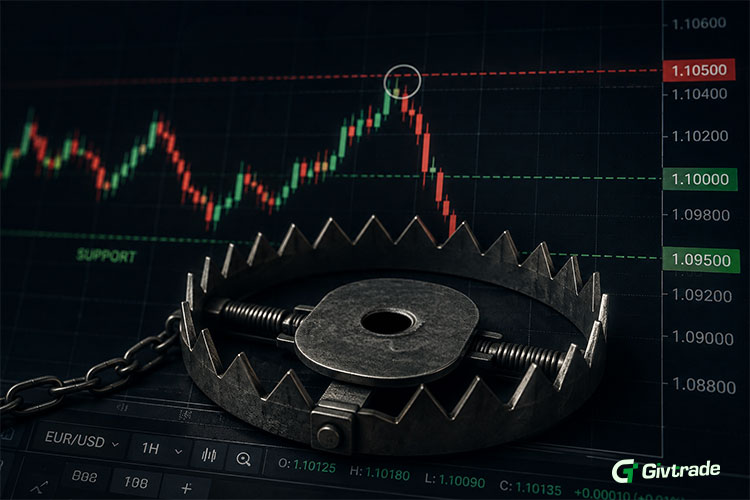
Table of Contents
1. What Is a Bear Trap? The Direct Answer
2. How a Bear Trap Forms: The Step-by-Step Mechanics
3. Bear Trap vs Genuine Breakdown: The Key Differences
4. Where Bear Traps Happen Most — Instruments and Conditions
5. The 5 Warning Signs GCC Traders Check Before Entering a Short
6. Real Market Examples: What Bear Traps Look Like in Practice
7. How to Trade After Spotting a Potential Bear Trap
8. Frequently Asked Questions
9. The Bottom Line
A bear trap is a false breakdown — a move below an established support level that looks like the beginning of a downtrend but quickly reverses upward, trapping traders who entered short positions. The name describes exactly what happens: the market drops through a level that signals “sell,” attracts short sellers expecting further declines, then snaps back sharply in the opposite direction — “trapping” the bears who entered short at the wrong moment. For UAE, Saudi Arabia, Kuwait, Qatar, Bahrain and Oman traders who use CFDs to short forex pairs, gold, oil, and indices, recognising the difference between a genuine breakdown and a bear trap before entering a position is one of the most high-value skills in active trading.
What Is a Bear Trap? The Direct Answer
How a Bear Trap Forms: The Step-by-Step Mechanics
Understanding the mechanics of a bear trap requires following the sequence of how it develops, not just recognising it after it has already reversed:
Step 1: An Established Support Level Exists
A support level is a price zone where buyers have previously stepped in and stopped a decline. The more times a price has bounced from the same level, the more “respected” that support is considered — and the more traders are watching it for a potential breakdown signal.
Step 2: Price Breaks Below Support
Price moves below the support level, often on an intraday basis or on a single candle. This triggers technical sell signals on charts: many trading platforms and algorithmic systems are programmed to initiate short positions when an established support is broken. A wave of short-selling begins.
Step 3: Volume Is Low or Declining
This is the critical warning sign that most traders who get caught in a bear trap miss: the breakdown occurs on low volume. A genuine breakdown — one that precedes a sustained downtrend — is typically accompanied by expanding volume, as the selling pressure behind the move is broad and institutional. A bear trap breakdown often occurs on thin, low-volume conditions: after hours, ahead of a major news event, or during low-liquidity sessions.
Step 4: Price Reverses Sharply Upward
Instead of continuing lower, price snaps back above the support level — often aggressively and quickly. The short sellers who entered on the breakdown are now on the wrong side of a move heading against them. Their stop-loss orders (placed above the support level, which has now been reclaimed) begin triggering, which itself adds buying pressure as stopped-out short sellers close their positions by buying. This creates a self-reinforcing reversal.
Step 5: The “Trap” Is Complete
Traders who shorted the breakdown are now holding losing positions in an asset moving against them. Those without stops face growing losses. Those with stops have been closed out at a loss. The market has effectively transferred money from the short-sellers to whoever was positioned long through the flush.
Bear Trap vs Genuine Breakdown: The Key Differences
Where Bear Traps Happen Most — Instruments and Conditions
Bear traps appear across all liquid instruments, but GCC traders consistently describe encountering them most frequently in specific conditions:
• Gold (XAU/USD) around key psychological levels. Round numbers ($3,000, $3,500, $4,000) attract heavy attention as support/resistance. Gold’s periodic sharp moves through these levels — followed by equally sharp reversals — are among the most frequently cited bear trap scenarios described by Gulf traders.
• Forex majors before scheduled data events. EUR/USD or GBP/USD can flush through support in the 30–60 minutes before an NFP or CPI release as thin liquidity and positioning creates an exaggerated move. The subsequent data release then drives the pair sharply higher, leaving traders who shorted the “breakdown” trapped.
• Oil during low-liquidity Asian session hours. Brent and WTI regularly see intraday dips below support levels during the Asian session (midnight to 8:00 AM UAE time) when fewer institutional participants are active, producing moves that reverse completely once London opens.
• Indices at known support zones. The Dow Jones and NASDAQ — both available on GivTrade’s markets platform — frequently create bear traps at prior lows or major moving averages, particularly during the first 30 minutes of the US session opening as volatility is highest and order flow can temporarily distort price direction.
The 5 Warning Signs GCC Traders Check Before Entering a Short
Experienced UAE and GCC traders who consistently avoid bear traps do not rely on a single signal. They check a combination of factors before entering any short position on a breakdown:
• 1. Wait for the candle to close below support, not just touch it. An intraday wick below support that closes back above is the most common bear trap setup. The close is the signal — not the intraday low. Traders who enter short when price “touches” support but has not yet closed below it are acting on incomplete information.
• 2. Check volume on the breakdown candle. If the candle breaking support is not accompanied by noticeably higher volume than recent candles, it is a warning sign. Thin volume breakdowns disproportionately produce traps.
• 3. Check the economic calendar before any short on a support break. If a high-impact event is scheduled within the next 30–60 minutes on the economic calendar, a support break just before it could easily reverse on the data release. Experienced GCC traders avoid entering new short positions within 30 minutes of scheduled high-impact releases.
• 4. Assess whether the breakdown aligns with the broader trend. A support break in an instrument that is in a clear, sustained uptrend carries far higher bear trap risk than a support break in a clearly downtrending instrument. Counter-trend short entries at support in uptrending markets are where bear traps most consistently bite GCC traders.
• 5. Look for confirmation on a higher timeframe. A 5-minute chart breakdown below support that is not confirmed on the 1-hour or 4-hour chart is inherently less reliable. Experienced traders consistently describe waiting for the higher timeframe to confirm the breakdown before committing to a short position.
Real Market Examples: What Bear Traps Look Like in Practice
Example 1: Gold Before a Fed Decision
Gold has repeatedly produced bear trap patterns in the session before FOMC decisions. The uncertainty around the Fed’s rate guidance causes gold to dip below a recent support level as traders pre-emptively position for a hawkish outcome. When the Fed delivers language that is less hawkish than feared — or cuts rates — gold reverses sharply, leaving the pre-event shorts in a losing position. GCC traders who follow the Fed’s meeting calendar and check gold’s position relative to support before FOMC days consistently describe treating those sessions with heightened bear trap caution.
Example 2: EUR/USD Before NFP
EUR/USD can fall through intraday support in the 30 minutes before the US Non-Farm Payrolls release as dollar buyers front-run the expectation of a strong jobs number. If the NFP prints weaker than forecast, EUR/USD reverses all the pre-release losses and more within minutes — a classic bear trap for traders who entered short on the pre-release flush. This is one of the most frequently cited trap scenarios among GCC forex traders who have learned to simply stay flat in the 30 minutes before NFP rather than chasing pre-release moves.
Example 3: Oil at Key Support During Asian Hours
Brent crude breaking below $70 or $75 during the Asian session on light volume, only to recover above the level when London opens, is a recurring pattern. Gulf traders who monitor oil understand that Asian session liquidity in crude is thin enough to produce exaggerated moves that do not reflect genuine selling conviction — and who wait for the London session confirmation before acting on apparent breakdowns, avoid the trap entirely.
How to Trade After Spotting a Potential Bear Trap
Identifying a potential bear trap creates a specific trading opportunity in the opposite direction — but only with the right confirmation and risk management:
• Wait for price to reclaim the support level. The confirmation of a bear trap is price moving back above the support it briefly broke. Entering long before this confirmation means guessing at the reversal rather than trading it.
• Enter on the reclaim, stop below the bear trap low. Once price has closed back above the broken support, a long entry with a stop loss below the intraday wick low is a defined-risk trade. The bear trap low becomes the invalidation point.
• Size appropriately. Bear trap reversals can be fast and volatile. The same position sizing discipline — 1–2% of account equity at risk — applies to bear trap trades as to any other entry.
• Use the bear trap pattern as a filter, not a standalone strategy. The most reliable bear trap trades occur when the pattern aligns with the broader trend (i.e., the false breakdown occurs in an uptrending instrument), there is a clear volume discrepancy on the breakdown candle, and no high-impact event is scheduled that could drive further selling even after a short-term recovery.
Frequently Asked Questions
What is a bear trap in forex trading?
A bear trap in forex trading is a false breakdown below an established support level that quickly reverses upward, trapping short sellers who entered expecting a continued decline. It occurs across all liquid forex pairs, gold, oil, and indices. The distinguishing characteristics are: a breakdown on low volume, a candle that either fails to close below support or reclaims it quickly, and a sharp reversal that often accelerates as trapped short sellers’ stop-loss orders trigger.
What is the difference between a bear trap and a genuine breakdown?
A genuine breakdown shows high or expanding volume on the break, a strong candle close below support (not just an intraday wick), sustained price action below the level across multiple candles, and consistency with the broader downtrend. A bear trap typically shows low volume on the break, an intraday wick that fails to close below support, brief duration below the level, and often occurs counter to the prevailing uptrend or immediately before a scheduled data release.
How do GCC traders avoid bear traps?
The five checks experienced UAE and GCC traders consistently apply: wait for the candle close below support (not just an intraday touch), confirm with higher-than-average volume on the breakdown candle, check the economic calendar for scheduled events within 30–60 minutes of the potential entry, assess whether the breakdown is counter to the prevailing trend, and seek confirmation on a higher timeframe chart before committing to a short position.
Do bear traps only happen in downtrending markets?
No — bear traps most commonly occur in uptrending markets, at support levels within the uptrend. A temporary break below support that quickly reverses to continue the uptrend is the archetypal bear trap scenario. Traders who try to short a pullback in a strong uptrend by entering on a support break are the most frequently caught. Genuine downtrend breakdowns (which are not traps) tend to occur after a clear trend change, distribution phase, or at structurally significant levels with high volume confirmation.
Can bear traps be traded profitably?
Yes. Once a bear trap is confirmed by price reclaiming the support level it briefly broke, a long entry with a stop below the trap low and a target at the next resistance is a defined-risk, defined-reward trade. The key is waiting for confirmation of the reclaim rather than anticipating the reversal. Many experienced GCC traders describe bear trap reversals as some of their most reliable setups specifically because the failed breakdown creates a clear invalidation point for the stop-loss.
The Bottom Line
A bear trap is one of the most common and costly traps in active trading — a false breakdown below support that reverses sharply, leaving short sellers with losses from a move that never materialised. For UAE, Saudi Arabia, Kuwait, Qatar, Bahrain and Oman traders, bear traps are particularly common in the instruments they trade most: gold around major psychological levels, forex pairs before high-impact data events, and oil during thin Asian session hours.
The traders across the GCC who avoid bear traps most consistently share five habits: they wait for candle closes rather than intraday touches, they check volume, they verify no scheduled event is imminent on the economic calendar, they assess trend alignment, and they seek higher timeframe confirmation before committing. None of these steps is complicated. All of them take less than two minutes. Together they separate the traders who have learned to wait for genuine breakdowns from those who consistently enter on false ones.
Risk Warning: Trading Forex and Contracts for Difference (CFDs) on margin carries a high level of risk and may not be suitable for all investors. Retail clients could sustain a total loss of deposited funds. This article is for informational and educational purposes only. GivTrade Mauritius, registration No. 197387, is authorized and regulated by the Financial Services Commission (FSC) License No. GB22201329.