

What Is RSI in Forex Trading and How Do GCC Traders Use It? (2026)
Most traders discover RSI early and misuse it for years. They see it cross 70, assume the market is about to fall, and sell. Then they watch the price keep climbing for another 200 pips.
The Relative Strength Index is one of the most powerful tools in a GCC trader's technical analysis toolkit - but only when it is understood correctly. Used as a standalone sell signal, it fails consistently. Used as a momentum filter alongside price action, it adds genuine edge.
For UAE and GCC traders already comfortable with moving averages and support and resistance, RSI is the natural next layer - a momentum reading that tells you not just where price is, but how fast it is moving and whether that speed is sustainable.
What RSI Actually Measures
RSI (Relative Strength Index) is a momentum oscillator that measures the speed and magnitude of recent price changes. It was developed by J. Welles Wilder and introduced in 1978. It remains one of the most widely used technical indicators across forex, commodities, and indices globally.
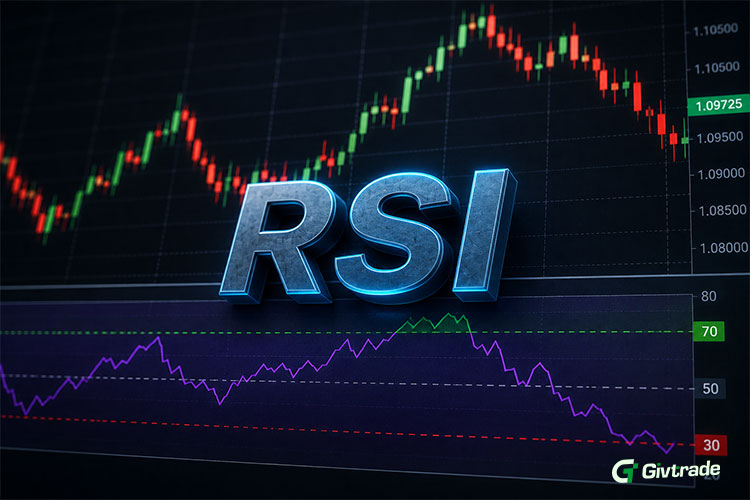
The indicator plots a single line that oscillates between 0 and 100. It calculates the ratio of average gains to average losses over a defined lookback period - typically 14 periods. When recent gains significantly outpace recent losses, RSI moves toward 100. When recent losses dominate, RSI moves toward 0.
The two levels most traders watch are 70 and 30. A reading above 70 is traditionally described as overbought. A reading below 30 is described as oversold. These labels are where most beginner traders make their first RSI mistake - treating overbought as a sell signal and oversold as a buy signal, regardless of market context.
Why Overbought Does Not Mean Sell
In a strong uptrend, RSI can remain above 70 for extended periods - sometimes weeks. A currency pair or commodity in a genuine bullish trend will repeatedly push RSI into overbought territory as buyers sustain upward momentum. Selling every time RSI crosses 70 in this environment means selling into a trend that has no intention of reversing.
The same applies in reverse. In a strong downtrend, RSI can sit below 30 for an extended period. Buying every oversold reading means buying into sustained selling pressure.
The correct interpretation is contextual. Overbought means momentum is stretched to the upside - not that a reversal is imminent. Oversold means momentum is stretched to the downside. What matters is whether that stretched momentum is occurring in a trending market or a ranging one, and what price action is doing at the same time.
How Experienced GCC Traders Use RSI
As a trend strength filter. In a confirmed uptrend - price above the 50 EMA on the daily chart - RSI readings that hold above 50 confirm bullish momentum is intact. A pullback that drops RSI toward 40-50 without breaking below it, followed by a bounce, is often a higher-conviction long entry than a reversal signal in isolation. For traders already using moving averages from our moving averages guide, RSI adds a momentum confirmation layer to the same setup.
As a divergence signal. RSI divergence is the most reliable and most underused RSI application. Bullish divergence occurs when price makes a lower low but RSI makes a higher low - momentum is weakening on the downside even as price continues falling. Bearish divergence occurs when price makes a higher high but RSI makes a lower high - upside momentum is fading even as price continues rising. Divergence does not predict the exact reversal point, but it flags that the current move is losing energy - a warning that experienced GCC traders use to tighten stops or reduce position size rather than add to a position.
As an overbought/oversold signal in ranging markets. In a clearly range-bound market - price bouncing between defined support and resistance with no trend - RSI overbought and oversold readings carry more weight. A touch of 70 near range resistance with a rejection candle is a more meaningful sell signal than the same RSI reading in the middle of a trend. Identifying whether the market is trending or ranging before applying RSI is the discipline that separates consistent RSI users from those who describe it as unreliable.
RSI Settings GCC Traders Use
The default 14-period RSI is the most widely watched setting - and because it is the default on MetaTrader 5, it is the setting most other traders are also watching. That matters: levels that many participants observe simultaneously tend to produce more consistent reactions.
Some GCC traders adjust the lookback period depending on their trading style. A shorter period (7-9) makes RSI more sensitive and generates more signals - useful for shorter-term traders but prone to more false readings. A longer period (21-25) smooths the line and reduces noise - useful for swing traders on higher timeframes. For most GCC traders starting with RSI, the default 14-period setting on the H4 or daily chart is the most practical starting point.
RSI and the Economic Calendar
RSI readings near key levels - overbought, oversold, or at divergence points - carry more weight when they align with macro context from the economic calendar. An RSI divergence signal on EUR/USD the day before a major Fed decision is a lower-conviction setup than the same divergence in a neutral macro week. Conversely, a post-NFP RSI reset from overbought back to 50 in an uptrend - where the data release provided the catalyst for a healthy pullback - is often a higher-conviction long entry because both the technical and fundamental context align.
The GivTrade Take
RSI is not a trade signal generator. It is a momentum context tool. The traders across the UAE and GCC who use it effectively share one discipline: they never act on an RSI reading in isolation. They check the trend direction first using moving averages, identify whether the market is trending or ranging, and then use RSI to assess whether momentum supports or contradicts the trade idea they already had.
A bearish RSI divergence on gold in an uptrend does not mean sell gold. It means the uptrend may be losing energy - tighten the stop on existing longs and wait for price confirmation before entering new ones. That is how a momentum indicator is supposed to work: not as a trigger, but as a filter that adds or removes conviction from a decision already grounded in price action and market context.
For GCC traders building a structured technical approach, RSI pairs naturally with moving averages and support and resistance - the full picture of where price is, what the trend is, and how much momentum is behind the current move. Explore all instruments where RSI applies on GivTrade's platform, from forex pairs to gold and oil CFDs, and check macro context on the economic calendar before every session.
Frequently Asked Questions
What is RSI in forex trading?
A momentum oscillator that measures the speed and size of recent price changes on a scale of 0 to 100 - used to identify momentum strength, trend continuation, and potential exhaustion points.
What does overbought and oversold mean in RSI?
A reading above 70 indicates recent gains have been strong relative to losses (overbought). Below 30 indicates recent losses have dominated (oversold). Neither is a standalone trade signal - context determines whether they are meaningful.
What is RSI divergence?
When price and RSI move in opposite directions - price making a new high while RSI makes a lower high, or price making a new low while RSI makes a higher low. Signals fading momentum and potential trend exhaustion.
What RSI setting should GCC traders use?
The default 14-period RSI on H4 or daily charts is the most widely watched and the most practical starting point. Shorter periods increase sensitivity; longer periods reduce noise.
Can RSI be used on gold and oil CFDs?
Yes - RSI applies to any instrument on MetaTrader 5, including XAU/USD, Brent crude, indices, and all forex pairs. The same overbought, oversold, and divergence principles apply across instruments.
Risk Warning: Trading forex and Contracts for Difference (CFDs) on margin carries a high level of risk. Retail clients could sustain a total loss of deposited funds. This article is for informational and educational purposes only and does not constitute investment advice. GivTrade Financial Services L.L.C S.O.C, CMA licence #20200000367. GivTrade Mauritius, registration No. 197387, is authorized and regulated by the Financial Services Commission (FSC) License No. GB22201329.